方法一
一、uni-app引用echarts
####### 首先,要去下载插件(用hbuilder编辑器下载特别方便)
l-echarts DCloud插件市场
## 使用
<template>
	<view><l-echart ref="chart" @finished="init"></l-echart></view>
</template>

<script>
	import LEchart from '@/uni_modules/lime-echart/components/l-echart/l-echart.vue';
	export default {
		components: {
			LEchart
		}
,
		data(){
			return{
				option: {
	                tooltip: {
	                    trigger: 'axis',
	                    axisPointer: {
	                        type: 'shadow'
	                    },
	                    confine: true
	                },
	                legend: {
	                    data: ['热度', '正面', '负面']
	                },
	                grid: {
	                    left: 20,
	                    right: 20,
	                    bottom: 15,
	                    top: 40,
	                    containLabel: true
	                },
	                xAxis: [
	                    {
	                        type: 'value',
	                        axisLine: {
	                            lineStyle: {
	                                color: '#999999'
	                            }
	                        },
	                        axisLabel: {
	                            color: '#666666'
	                        }
	                    }
	                ],
	                yAxis: [
	                    {
	                        type: 'category',
	                        axisTick: { show: false },
	                        data: ['汽车之家', '今日头条', '百度贴吧', '一点资讯', '微信', '微博', '知乎'],
	                        axisLine: {
	                            lineStyle: {
	                                color: '#999999'
	                            }
	                        },
	                        axisLabel: {
	                            color: '#666666'
	                        }
	                    }
	                ],
	                series: [
	                    {
	                        name: '热度',
	                        type: 'bar',
	                        label: {
	                            normal: {
	                                show: true,
	                                position: 'inside'
	                            }
	                        },
	                        data: [300, 270, 340, 344, 300, 320, 310],
	                    },
	                    {
	                        name: '正面',
	                        type: 'bar',
	                        stack: '总量',
	                        label: {
	                            normal: {
	                                show: true
	                            }
	                        },
	                        data: [120, 102, 141, 174, 190, 250, 220]
	                    },
	                    {
	                        name: '负面',
	                        type: 'bar',
	                        stack: '总量',
	                        label: {
	                            normal: {
	                                show: true,
	                                position: 'left'
	                            }
	                        },
	                        data: [-20, -32, -21, -34, -90, -130, -110]
	                    }
	                ]
	            },
			}
		},

		// 组件能被调用必须是组件的节点已经被渲染到页面上
	    // 1、在页面mounted里调用,有时候mounted 组件也未必渲染完成
	    mounted() {
	        // init(echarts, theme?:string, opts?:{}, chart => {})
	        // echarts 必填, 非nvue必填,nvue不用填
	        // theme 可选,应用的主题,目前只支持名称,如:'dark'
	        // opts = { // 可选
	        //  locale?: string  // 从 `5.0.0` 开始支持
	        // }
	        // chart => {} , callback 必填,返回图表实例
	        this.$refs.chart.init(echarts, chart => {
	            chart.setOption(this.option);
	        });
	    },

		// 2、或者使用组件的finished事件里调用
	    methods: {
	        init() {
	            this.$refs.chart.init(echarts, chart => {
	                chart.setOption(this.option);
	            });
	        }
	    }

	}
</script>
二、解决ecahrts.js文件过大的问题
####### 首先,要去echarts官网自定义构建并下载文件
ECharts 在线构建 (apache.org)
下载的是echarts.min.js文件
其次就是替换文件了
将项目中的echarts.js替换成echarts.min.js文件

方法二
微信小程序 ecahrts
正文
一、uni-app引用echarts
######## 首先,要去下载插件(用hbuilder编辑器下载特别方便)
echarts-for-wx DCloud插件市场
使用HBuilder导入之后,会生成一个js_sdk目录
######## 其次,只需要将js_sdk下的uni-ec-canvas目录复制到components目录下面就成功引入了
######## 之后,在pages中建立页面并复制如下代码就可以展示图表了
## 折线图
<template>
  <view>
    <uni-ec-canvas class="uni-ec-canvas" id="uni-ec-canvas" ref="canvas" canvas-id="uni-ec-canvas" :ec="ec">
    </uni-ec-canvas>
  </view>
</template>

<script>
  import uniEcCanvas from '@/components/uni-ec-canvas/uni-ec-canvas.vue'
  import * as echarts from '@/components/uni-ec-canvas/echarts'
  let chart = null
  export default {
    components: {
      uniEcCanvas
    },
    data() {
      return {
        ec: {
          lazyLoad: true
        },
        option: {
          tooltip: {
            trigger: 'axis',
            axisPointer: { // 坐标轴指示器,坐标轴触发有效
              type: 'shadow' // 默认为直线,可选为:'line' | 'shadow'
            }
          },
          grid: {
            left: '40',
            right: '40',
            bottom: '3%',
            containLabel: true
          },
          xAxis: {
            type: 'category',
            axisTick: {
              show: false,
            },
            nameTextStyle: {
              color: '#666666'
            },
            axisLabel: {
              show: true,
              textStyle: {
                color: '#666',
                fontSize: '12',
                fontWeight:'bold'
              }
            },
            axisLine: {
              lineStyle: {
                color: '#666',
                width: 1
              }
            },
            data: ["寿险", "重疾", "意外", "医疗", "年金"],
          },
          yAxis: {
            type: 'value',
            axisLine: {
              show: false, //y轴线消失

            },
            axisLabel: {
              show: true,
              textStyle: {
                color: '#666',
                fontSize: '11'
              }
            },

            axisTick: {
              show: false,
            },
          },
          series: [{
            barWidth: 20,
            type: 'bar',
            data: [20, 50, 40, 10, 20],
            itemStyle: {
              normal: {
                //每根柱子颜色设置
                color: function(params) {
                  const colorList = ["#FFC600", "#21A5FF", "#FF6000", "#00D69C",
                    "#998BFF"
                  ];
                  return colorList[params.dataIndex];
                }
              }
            },
            label: {
              show: true,
              position: 'top',
              formatter: '{c}万',
              color: '#666666',
              fontStyle: 'PingFang SC',
              fontWeight: 'bold',
              fontSize:'8'
            }
          }]
        },
      }
    },
    methods: {
      initChart(canvas, width, height, canvasDpr) {
        console.log(canvas, width, height, canvasDpr)
        chart = echarts.init(canvas, null, {
          width: width,
          height: height,
          devicePixelRatio: canvasDpr
        })
        canvas.setChart(chart)
        chart.setOption(this.option)
        return chart
      },
    },
    onLoad() {
      setTimeout(() => {
        console.log(this.$refs)
      }, 2000)
      this.$refs.canvas.init(this.initChart)
    },
  }
</script>
// 这里一定要注意 设置该组件宽高 以及display:block来确保canvas初始化的时候是有宽高的
<style>
  .uni-ec-canvas {
    width: 100%;
    height: 500rpx;
    display: block;
    margin-top: 30rpx;
  }
</style>
二、解决ecahrts.js文件过大的问题
####### 首先,要去echarts官网自定义构建并下载文件
ECharts 在线构建 (apache.org)
下载的是echarts.min.js文件
####### 其次就是替换文件了
将项目中的echarts.js替换成echarts.min.js文件
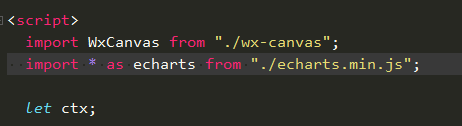
并修改导入的文件
有两个文件要修改: 一是uni-ec-canvas.vue,二是我们建立的test.vue
将echarts.js修改成echarts.min.js
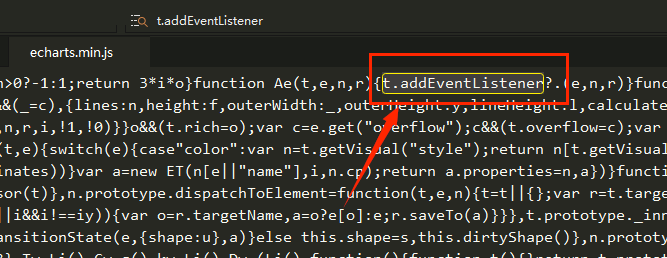
修改完之后会报错了,解决方法:
打开echarts.min.js 搜索字符串 t.addEventListener
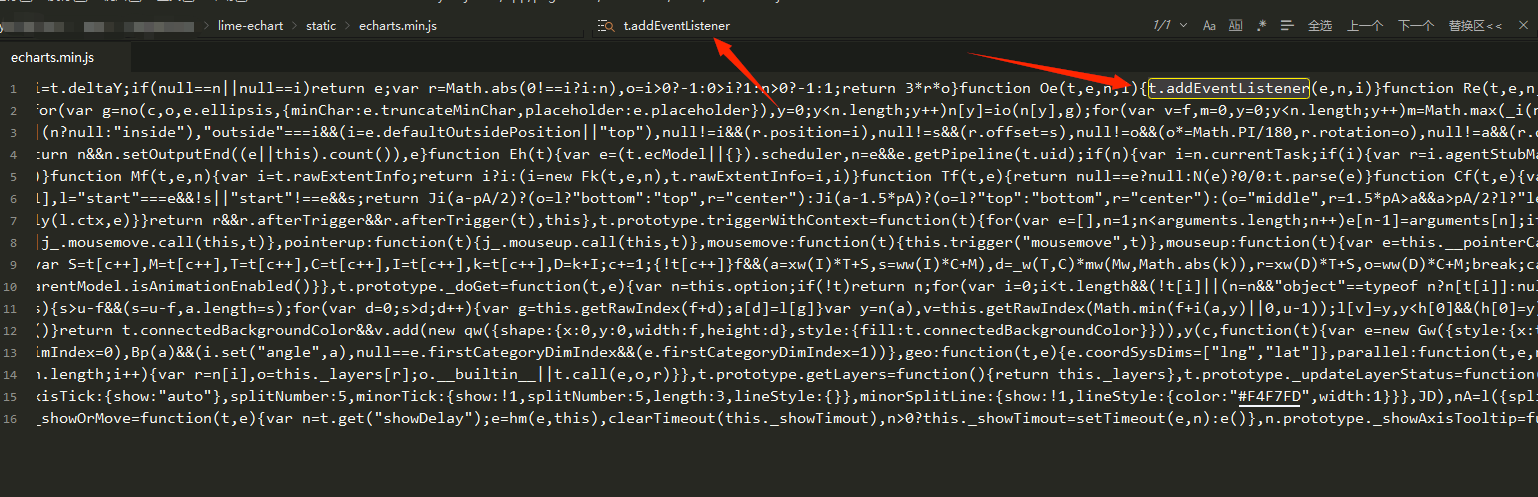
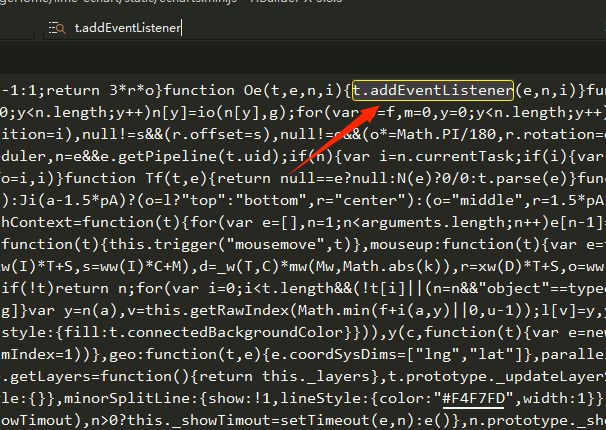
搜索到之后,在 t.addEventListener 后面添加 ?.